Turn Data Into Decisions That Drive Revenue
I design and build decision-ready Power BI dashboards that
teams can use immediately.
From messy data to clear KPIs, trusted numbers, and
confident decisions.
Current Projects
A selection of my recent open-source work and public project contributions, hosted on GitHub.
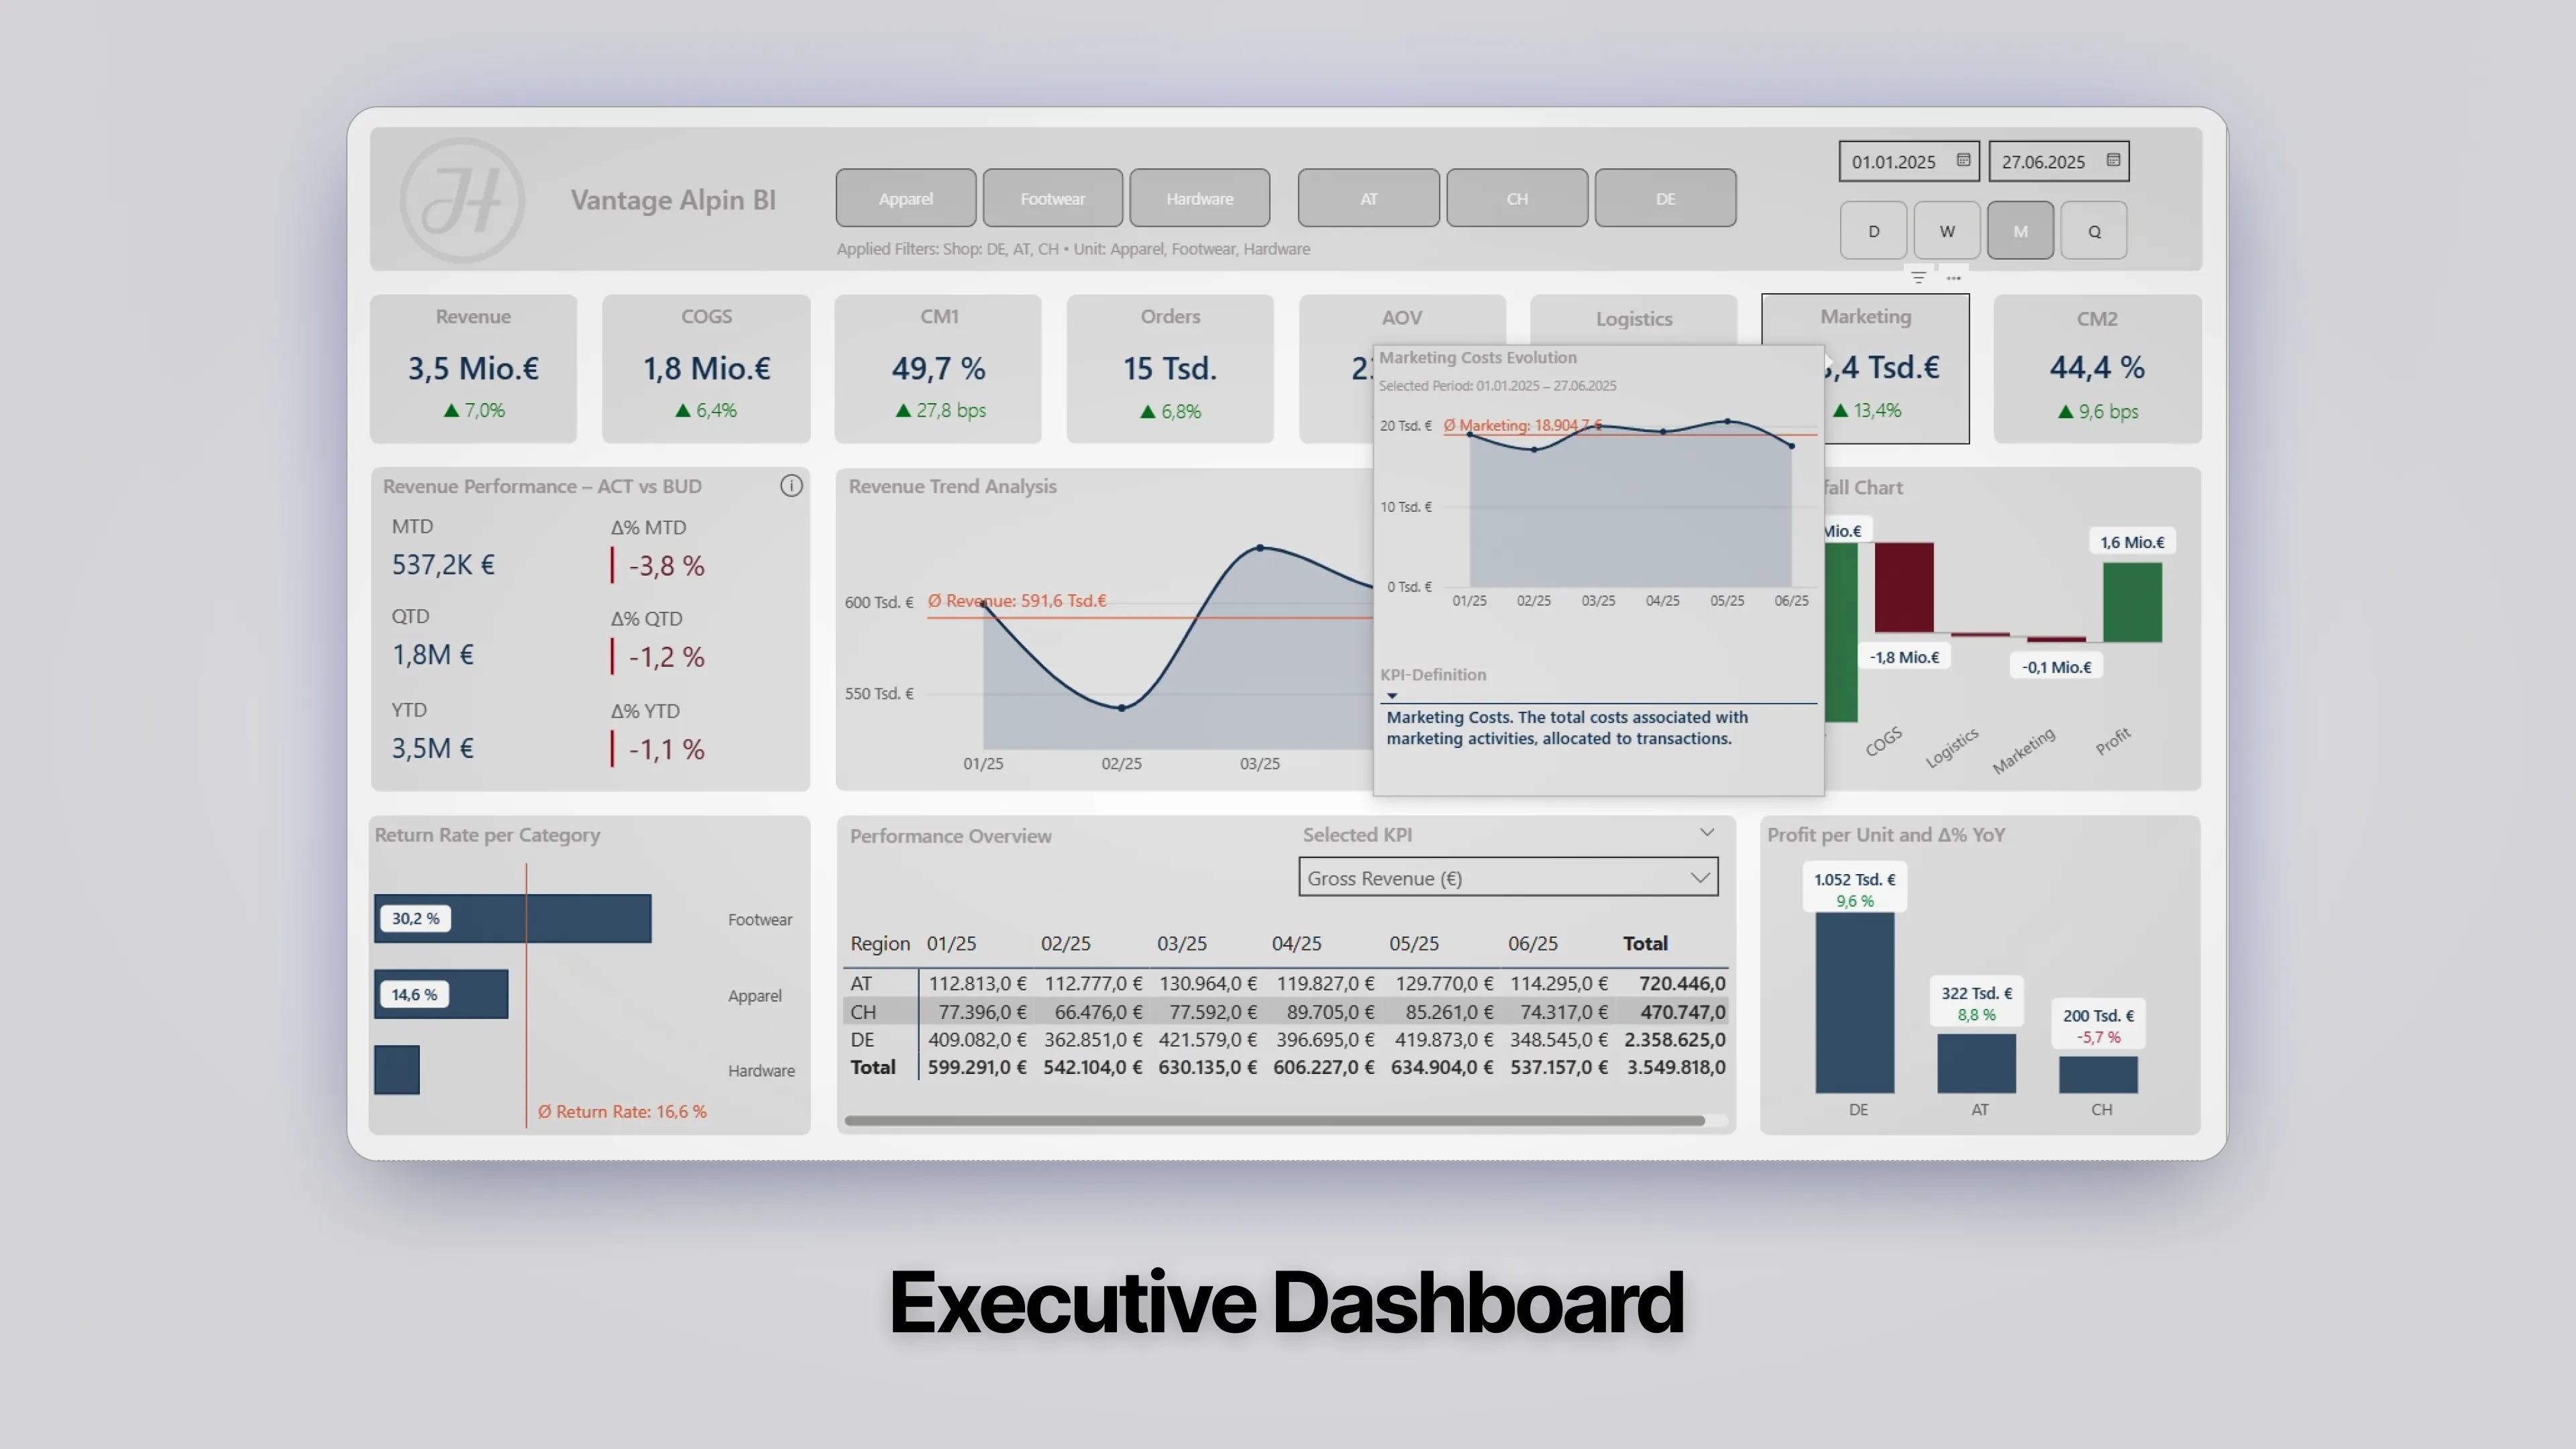
Vantage Alpin: Analytics Engineering
Production financial reporting engine replacing legacy PDF reports with a dynamic, decision-ready Power BI system.
Concept
This project acts as the central financial reporting engine for Vantage Alpin. It replaces legacy PDF reports with a dynamic Modern Data Stack (MDS) that processes stochastic transaction data into a clean Star Schema.
Features
- Controlled Stochasticity: Uses Non-Homogeneous Poisson Processes (NHPP) to model realistic demand patterns.
- Product Economics: Pricing follows Log-Normal distributions; popularity follows Pareto (Power Law).
- Marketing Attribution: Algorithmic allocation of ad spend to order lines based on revenue share.
Architecture
- Star Schema: Central
fct_transactionstable linking to Type 1 SCD product dimensions. - Currency Normalization: Robust handling of multi-currency transactions (EUR/CHF) with daily rate lookups.
- DirectQuery-like Extract: Custom Parquet/CSV export workflow from DuckDB to Power BI for performant local development.
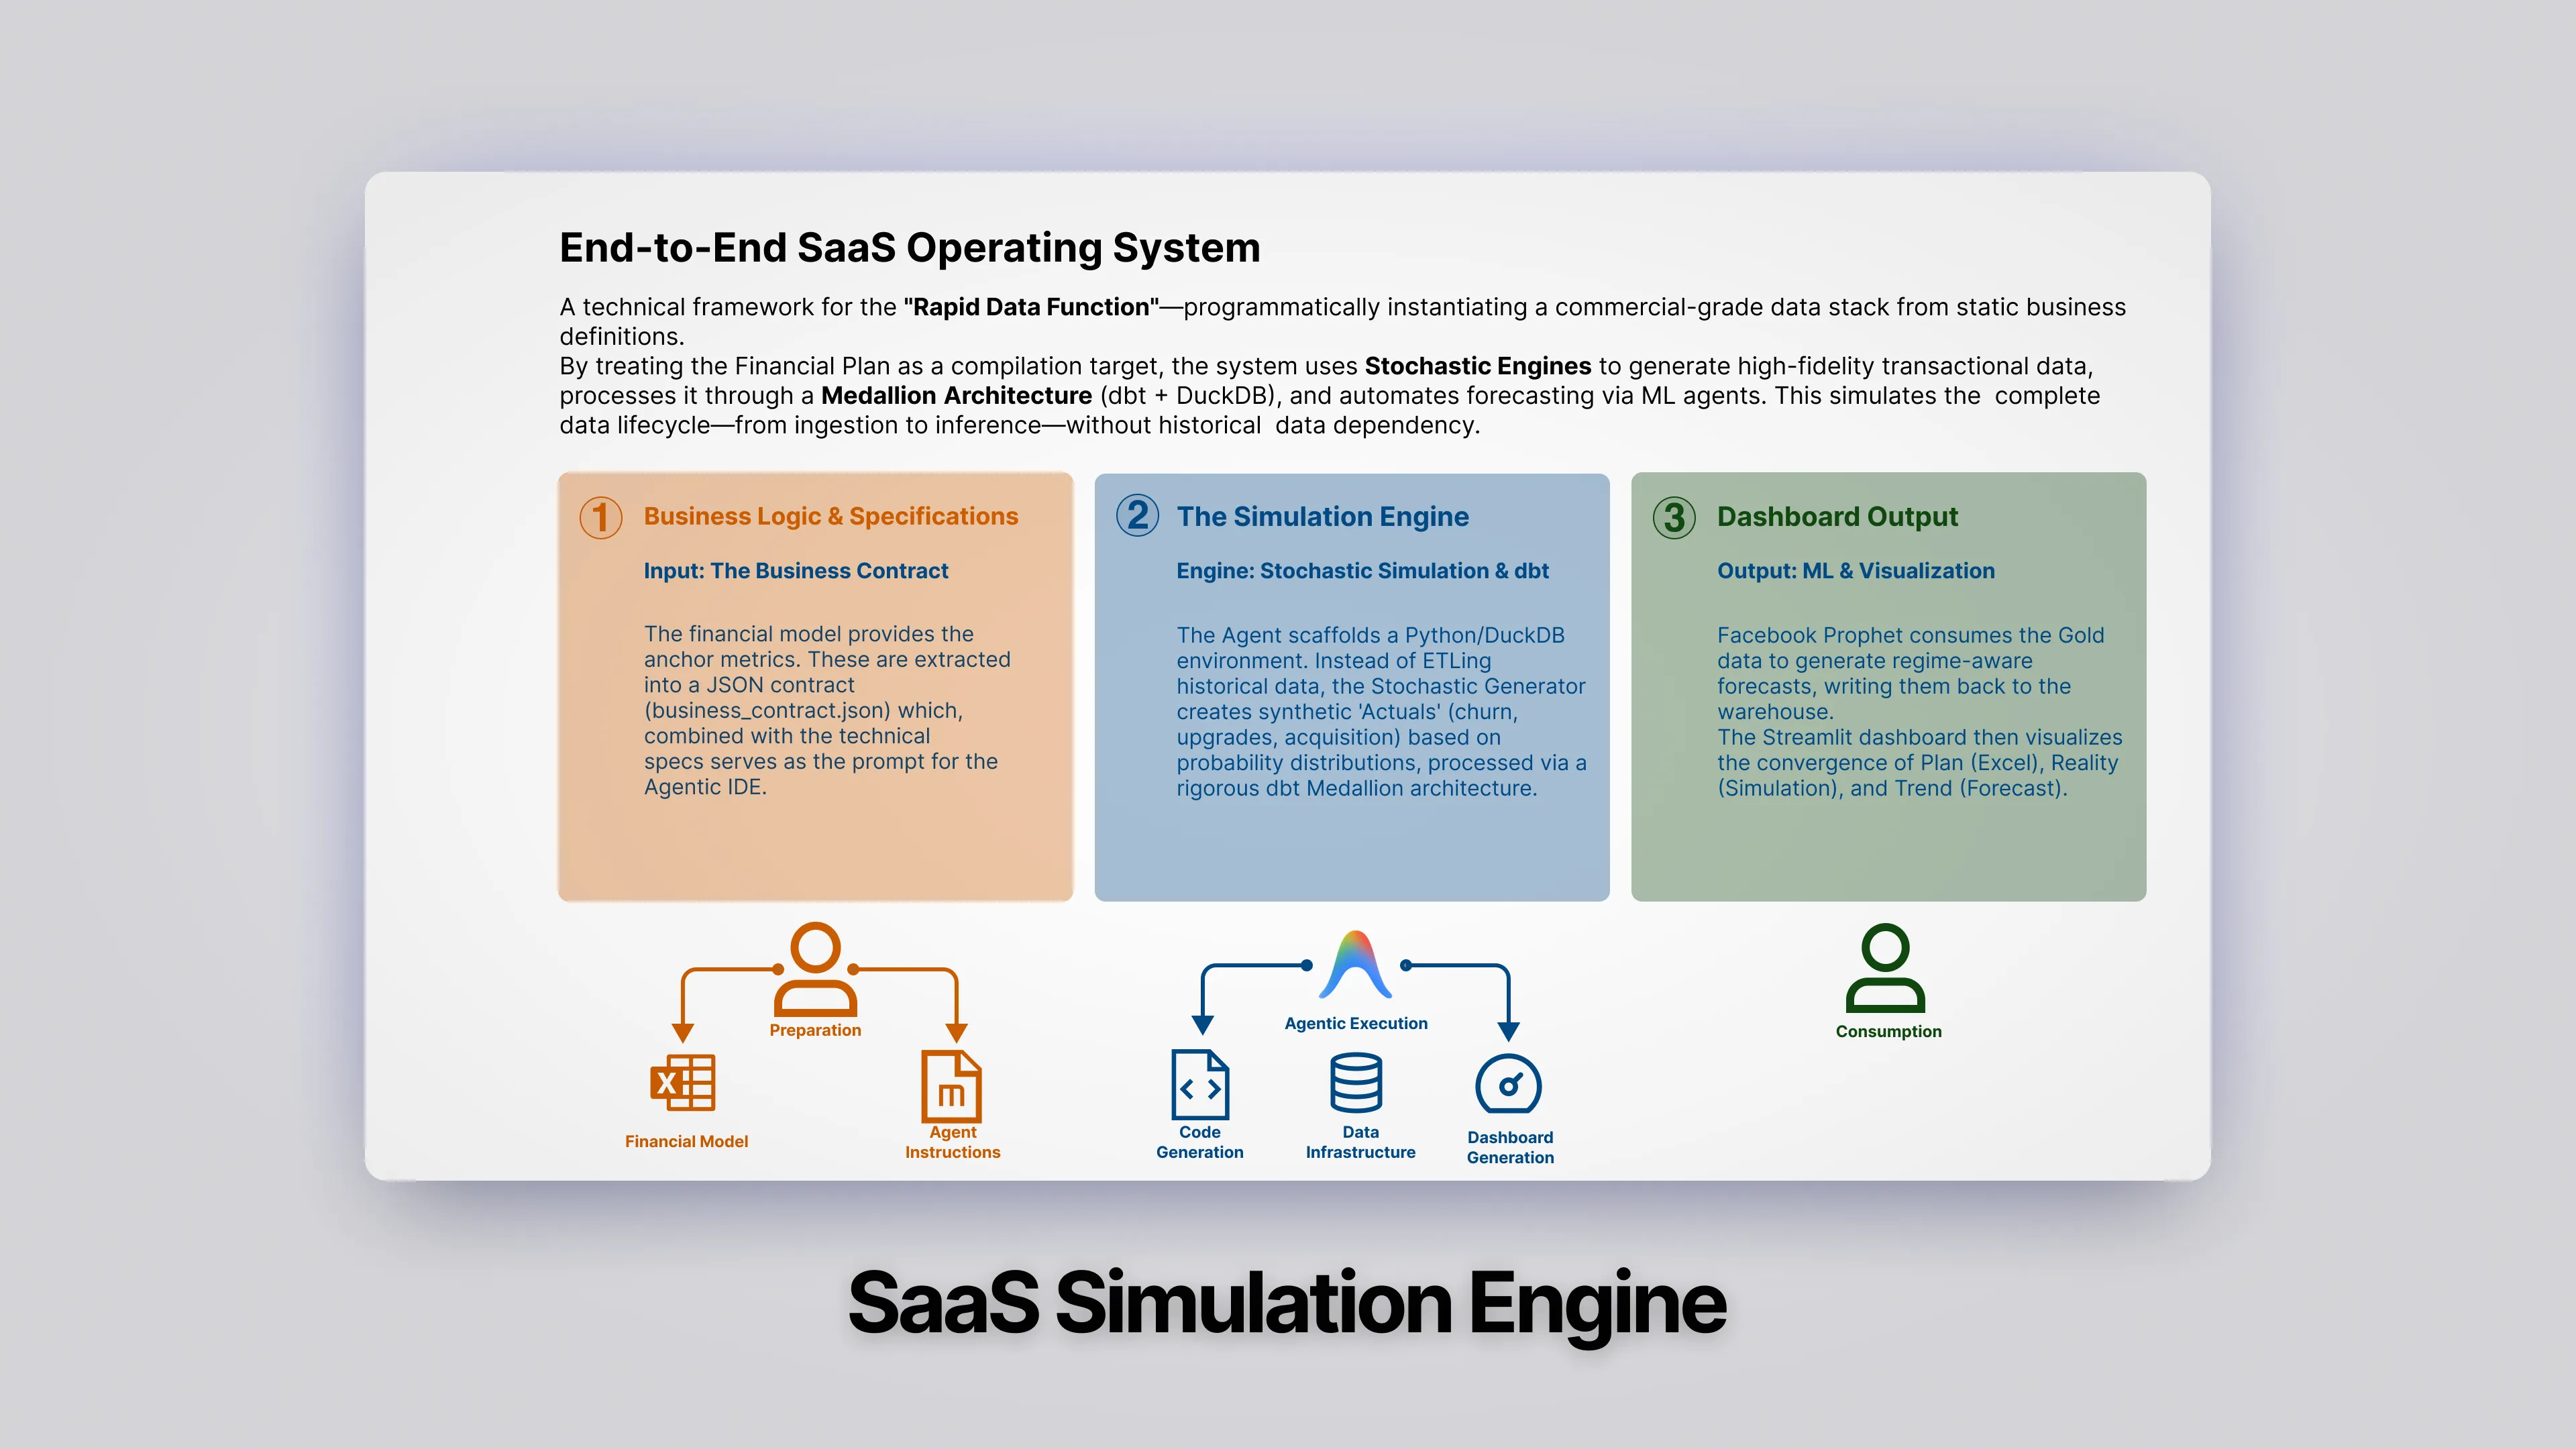
End-to-End SaaS Operating System
A full-stack simulation engine that translates static business plans into living data systems.
Concept
This project implements a "Rapid Data Function"—instantiating an entire end-to-end data stack (Stochastic Simulation, Data Warehouse, Algorithmic Forecasting, and BI) purely from a static business definition.
Features
- Stochastic Engine: Simulates Customer Acquisition (Poisson), Retention (Hazard/Survival), and Revenue expansion.
- Regime-Aware Forecasting: A Prophet model that detects "Growth Regimes" to avoid overfitting on early-stage data.
Architecture
- Contract-First Engineering: The entire simulation scales dynamically based on a JSON contract extracted from the Excel Operating Plan.
- Medallion DWH: A rigorous dbt project structure (Bronze/Silver/Gold) ensuring clean lineage.
- Agentic Build Pipeline: Treating business logic as code, we use cursor/windsurf to scaffold the entire stack from specs.
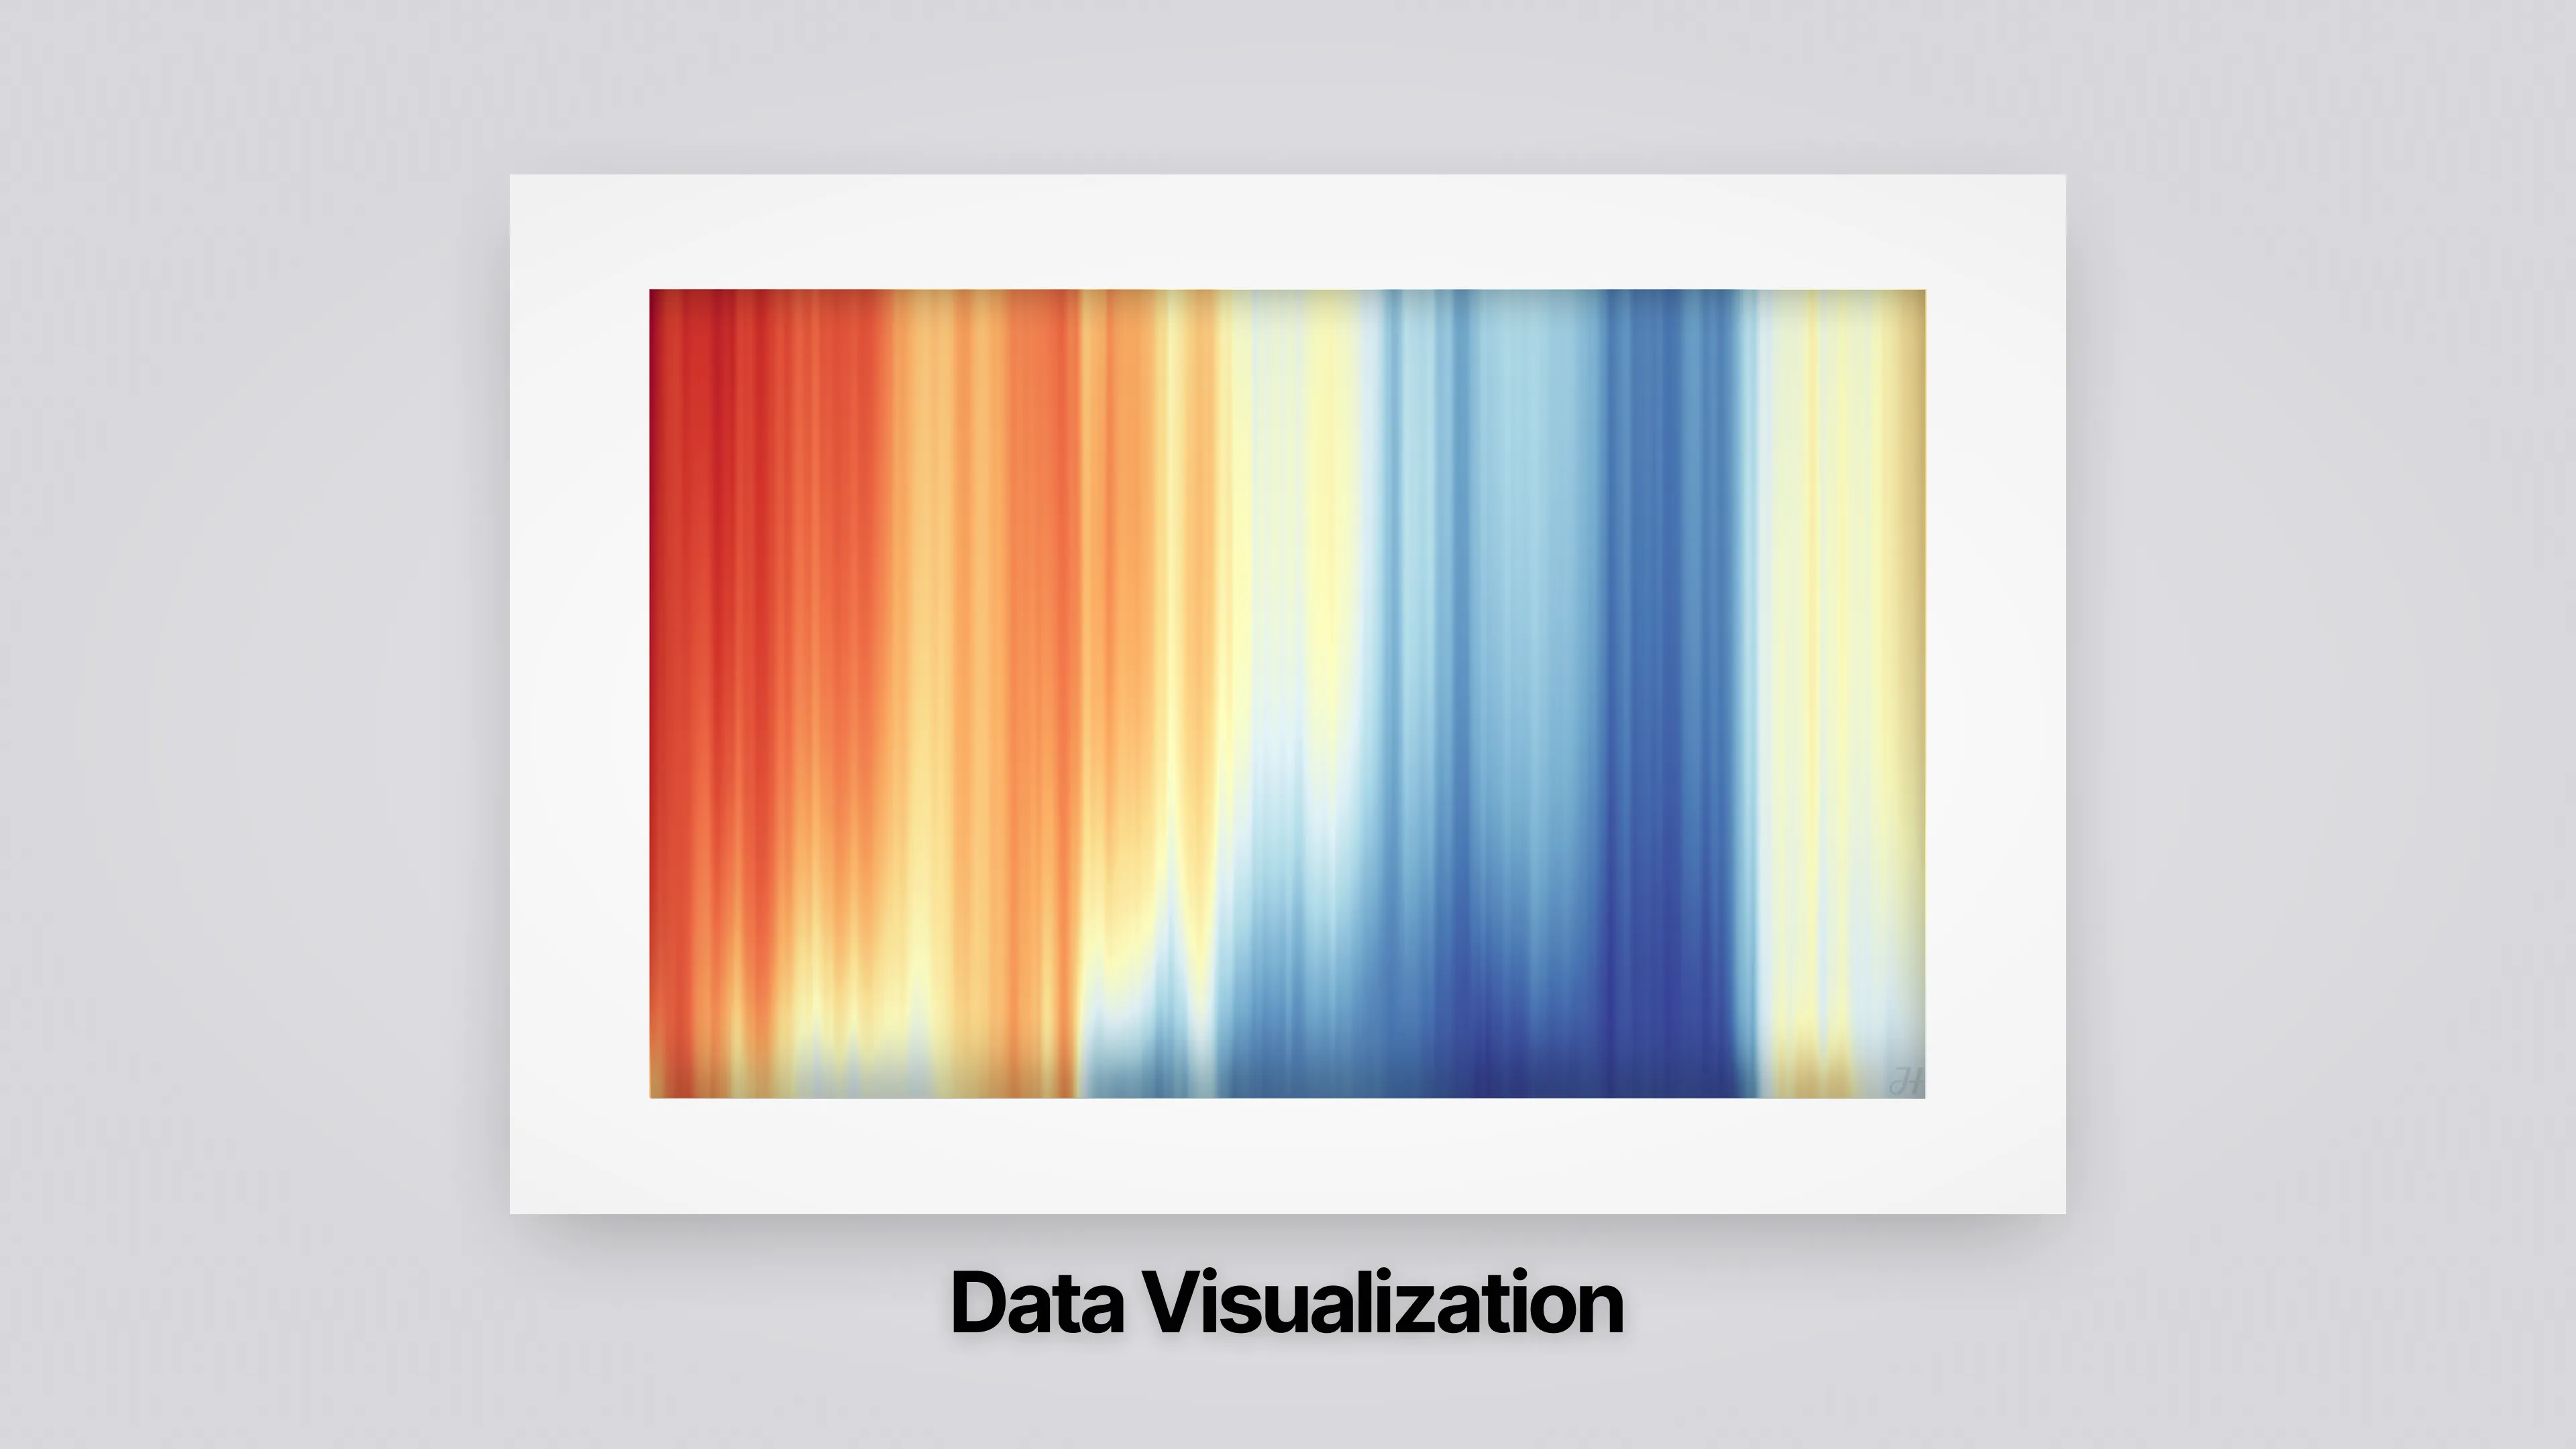
Yield Curve Explorer
Data visualizations turning financial market data into clear narratives.
Concept
A growing collection of data visualizations focused on financial and macroeconomic signals. Each piece is built to make complex datasets accessible — prioritizing clarity, context, and visual precision over decoration.
Features
- Yield Curve Heatmap: German government bond yields over time, sourced from the Bundesbank API. Reveals term structure shifts and inversion patterns at a glance.
Architecture
Built with Python and Plotly, pulling live data from public APIs. Designed for reproducibility — each visualization is self-contained and documented.